Amplyfi - Designing Real-Time Business Intelligence from Concept to Alpha
2021
Client
Amplyfi

Context
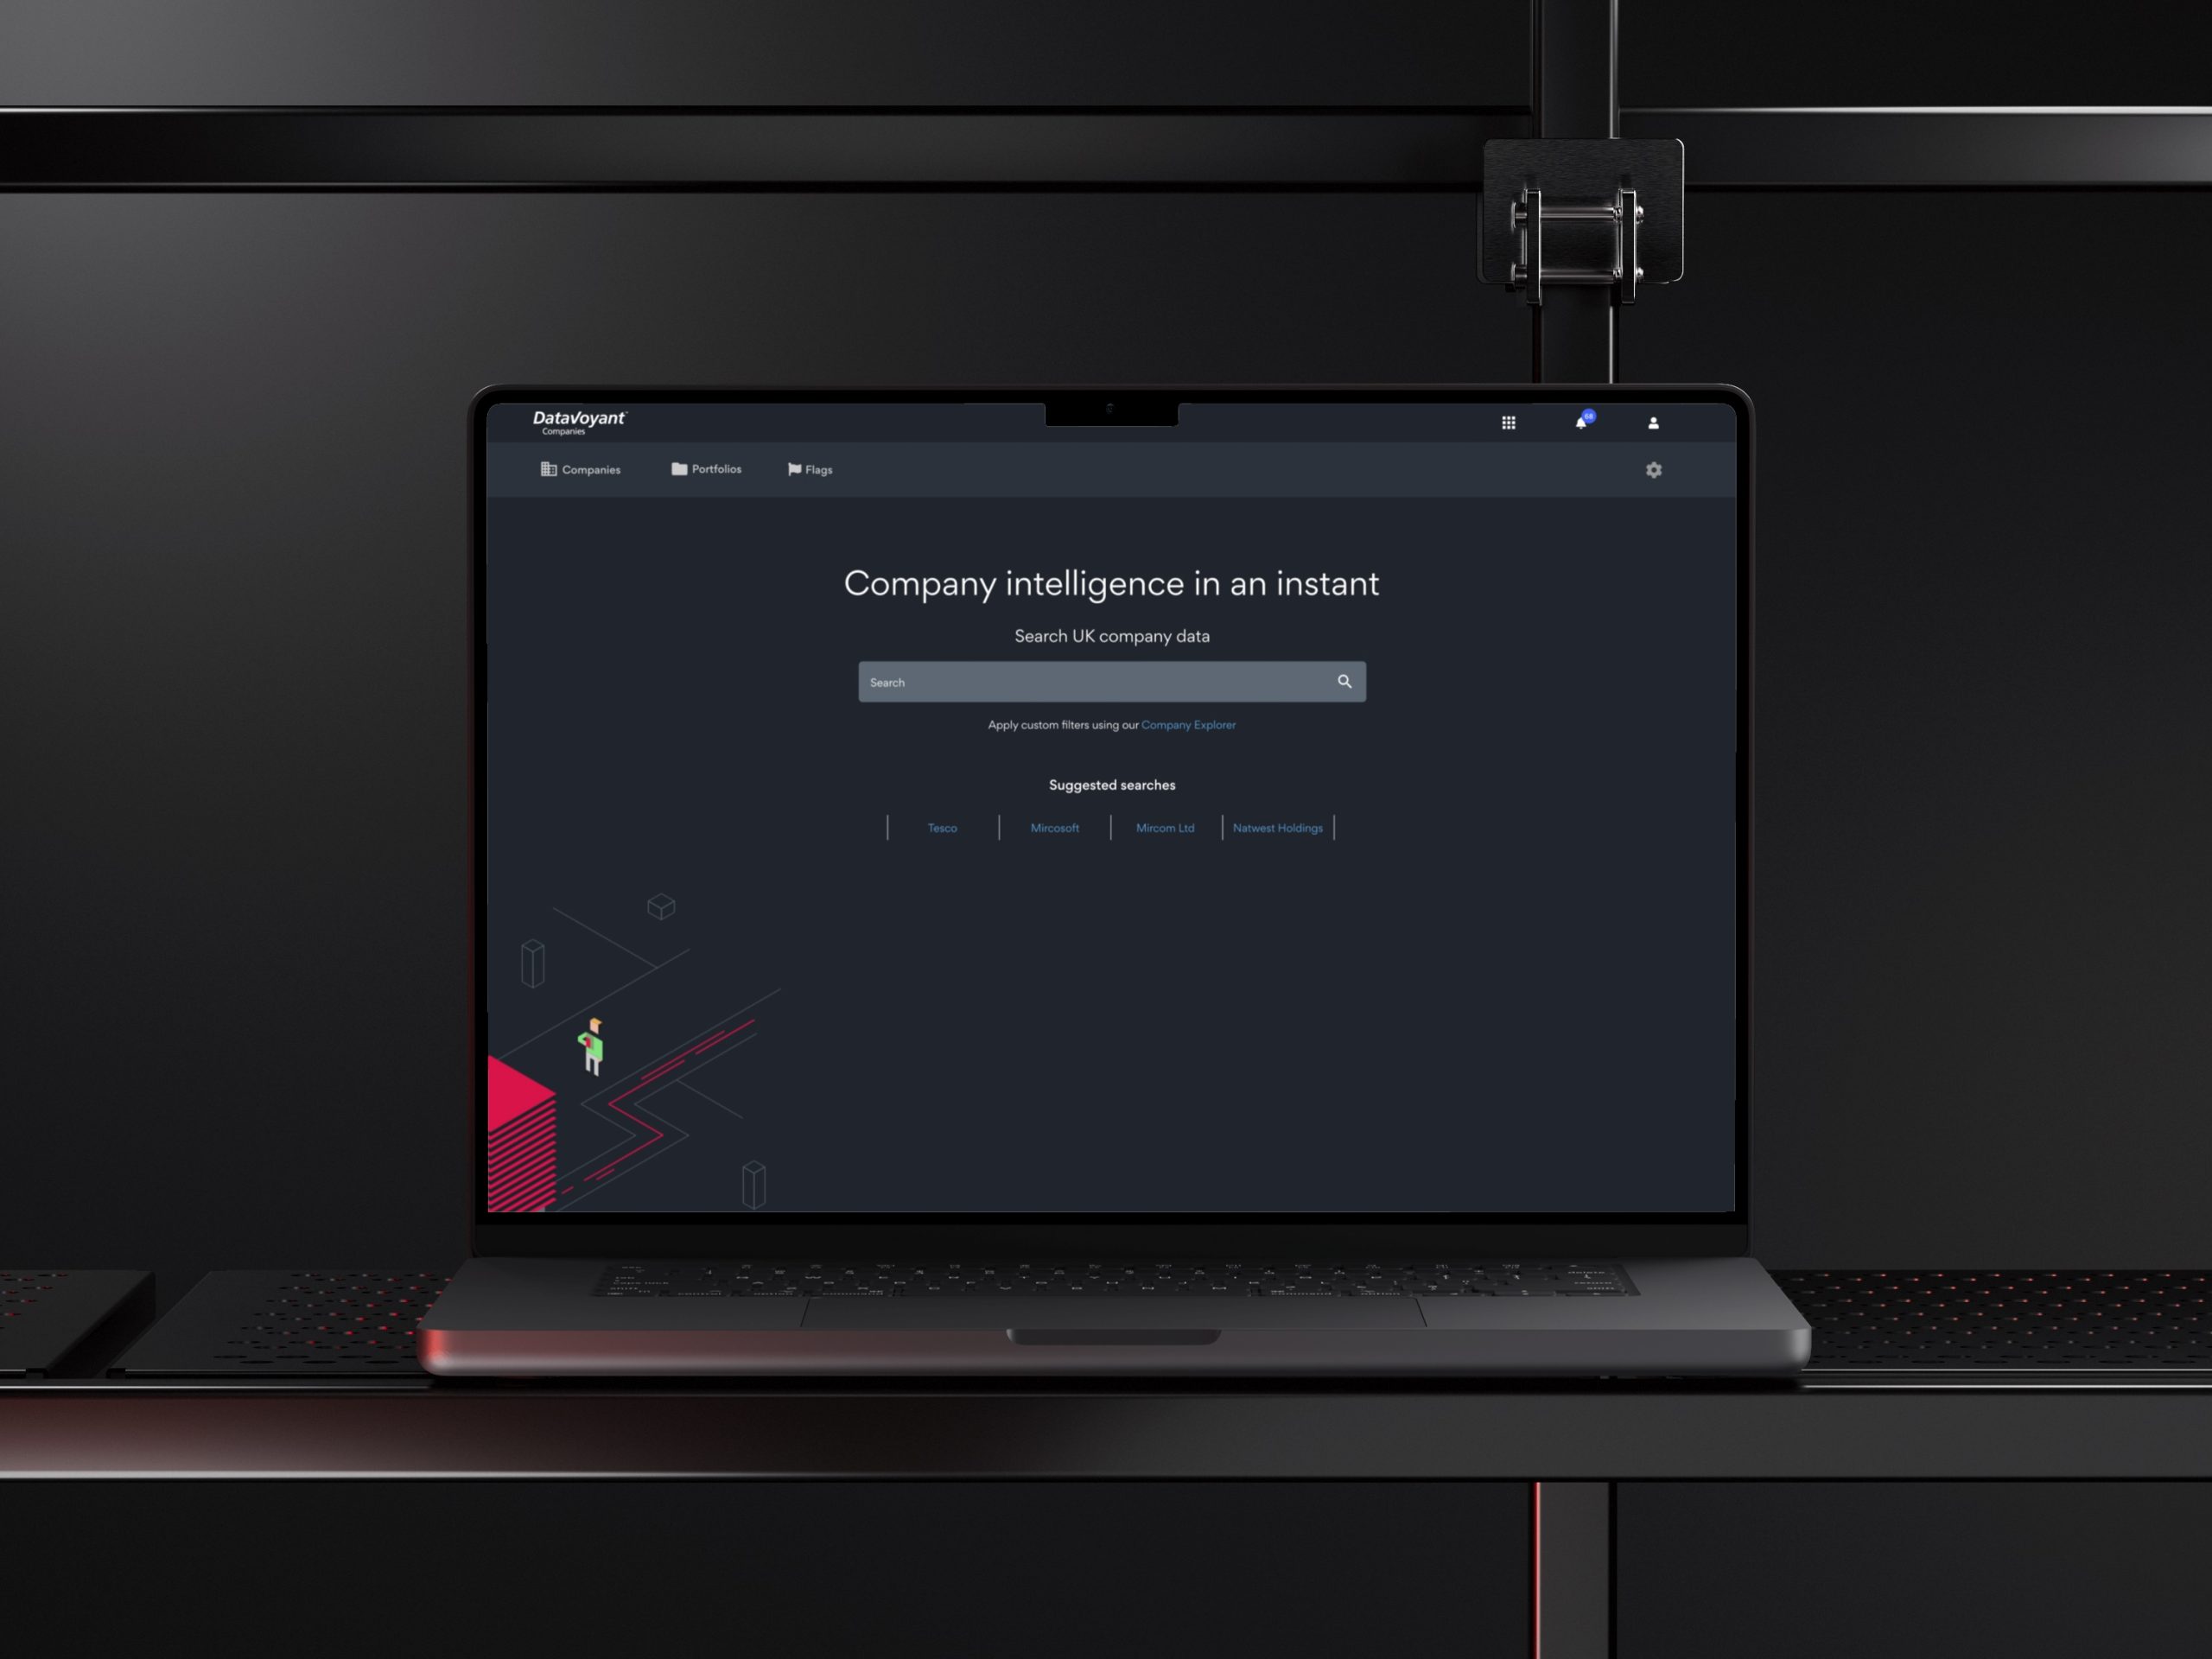
Amplyfi were looking to build a competitive intelligence platform that could help organisations monitor market changes and assess business risk in near real-time. DataVoyant Companies is a business intelligence tool that enables actionable insights by blending multiple structured standard data sources to enable near real-time monitoring of key company changes.
The brief was to deliver a working MVP within six months covering full UK company data with portfolio management capabilities, near real-time stock market updates, risk monitoring, alerting, and reporting features.
I was brought in to lead the product design from concept through to alpha release, working alongside founders, product lead, data scientists, and early clients to define and build the platform.
The challenge
The challenge was creating a product that served two very different user needs:
- Strategic users needed high-level insights quickly to inform business decisions
- Analyst users wanted detailed data exploration for competitive research
- Casual users needed an approachable entry point without overwhelming complexity
The platform had to make sense of multiple data types (funding events, patent data, news mentions, company relationships) while remaining accessible to users who weren’t data specialists.
Additionally, as an alpha product, we needed to validate product-market fit quickly while building something scalable enough to grow into a full SaaS offering.
Research and Insights
I led the product definition phase through a structured discovery process:
Competitor research and analysis:
- Conducted comprehensive analysis across existing business intelligence platforms
- Identified gaps between basic company databases and expensive enterprise solutions
- Found that most tools either oversimplified the data or overwhelmed users with complexity
Discovery workshops:
- Facilitated sessions with stakeholders and engineering teams to align on vision and technical constraints
- Defined core value propositions and MVP scope
- Mapped technical feasibility against user needs and business goals
User research:
- Conducted user interviews to understand how analysts and decision-makers currently monitored companies
- Developed personas representing different user types and their research workflows
- Created experience maps showing how users moved from broad exploration to detailed analysis
- Prioritised features for alpha release based on validated user needs
Key insights:
- Users wanted to start broad and drill down progressively, not the reverse
- Narrative summaries helped users quickly assess relevance before diving deep
- Confidence in data sources was critical for enterprise adoption
- Users valued seeing connections between companies, not just isolated profiles
- Real-time alerts needed to be configurable to avoid overwhelming users
- Portfolio management required flexible grouping and comparison tools
Process
Working within a six-month timeline, I established a comprehensive design approach:
- Competitor research and analysis to understand the business intelligence landscape and identify opportunities
- Discovery workshop facilitation with stakeholders and engineering teams to align on vision and technical constraints
- Persona development and experience mapping through user interviews to understand different user needs
- Product definition including roadmap development and feature prioritisation
- Concepts and sketches to explore different approaches to data organisation and hierarchy
- Wireframes and basic prototypes to test core user flows with stakeholders and early users
- Design system creation built from scratch to ensure consistency across the platform
- Data visualisation library with 15+ custom components for different data types and insights
- High-fidelity design and presentation with regular feedback sessions to validate direction
- User testing, analysis and iteration based on real user behaviour and feedback
- Feedback workshops to refine and improve the experience throughout development
I maintained close collaboration with data scientists and engineers throughout to ensure
Solution
I designed a flexible platform that balanced broad exploration with detailed analysis:
Company exploration:
- Company cards provided scannable overviews of key metrics and recent activity
- Advanced filter system enabled users to narrow datasets by industry, funding stage, location, and risk indicators
- Narrative summaries offered quick context before users invested time in detailed research
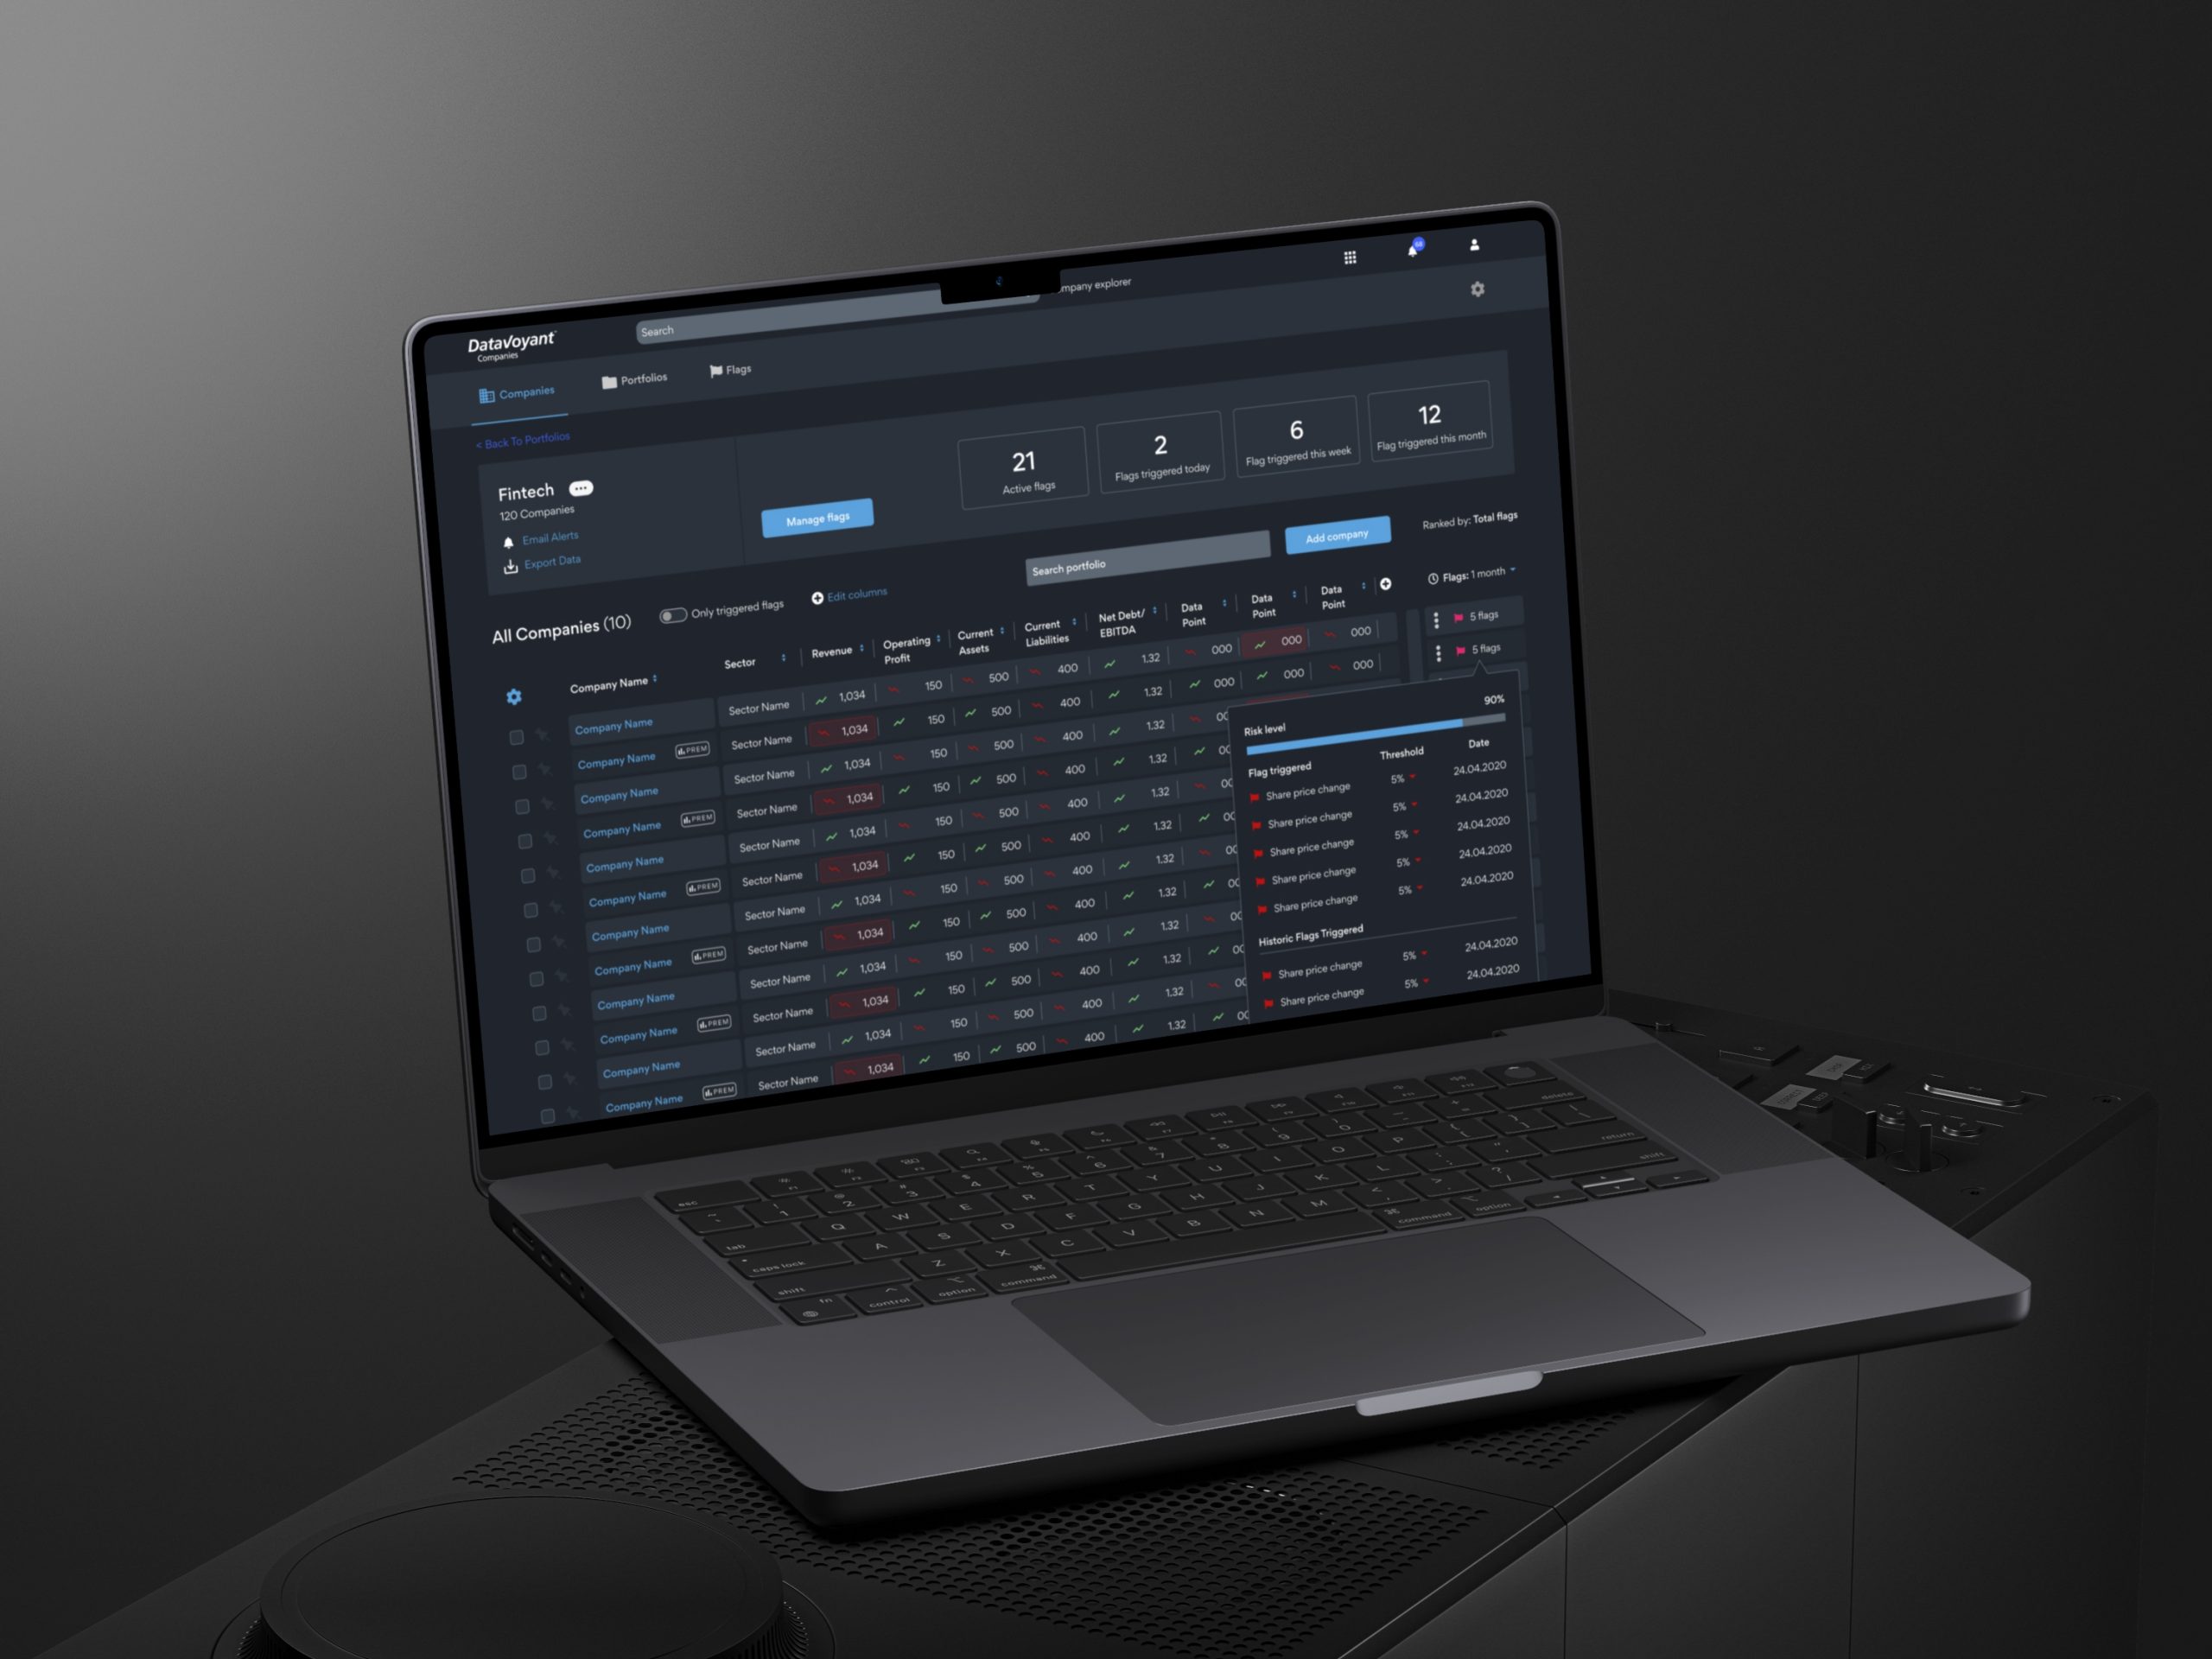
Portfolio management:
- Custom portfolio views for tracking multiple companies simultaneously
- Comparison tools to assess companies side-by-side
- Saved searches and collections for recurring research needs
- Flexible grouping and tagging for different portfolio strategies
Real-time monitoring:
- Near real-time stock market updates integrated directly into company profiles
- Configurable alerting system for significant company changes
- Activity timelines showing company evolution and key events
- Visual indicators showing data freshness and update frequency
Risk assessment and reporting:
- Risk indicators surfaced critical signals across financial, operational, and market factors
- Interactive timelines revealed funding patterns and business trajectory
- Automated reporting features for generating insights and summaries
- Export capabilities for sharing analysis with stakeholders
- Relationship mapping connected companies through partnerships, acquisitions, and shared investors
Data visualisation library:
- Designed 15+ custom components for different data types and insights
- Consistent visual language made complex structured data patterns immediately recognisable
- Scalable patterns built for enterprise SaaS needs
Design system:
- Built comprehensive foundation from scratch for consistency and future scaling
- Created component library enabling rapid feature development
- Established patterns that could evolve as the product matured
Key Design Decisions and Challenges
Balancing breadth and depth
The core design challenge was allowing users to scan many companies quickly while also enabling deep dives into individual organisations. I solved this through a progressive disclosure model where company cards revealed just enough information to judge relevance, with clear pathways to detailed views.
Making complex data approachable
Enterprise data can be intimidating. I used visual hierarchy and plain language to make technical concepts (patent classifications, funding rounds, corporate structures) accessible without oversimplifying. Visual indicators and colour coding helped users quickly understand data significance.
Designing for an emerging product
As an alpha product, we didn’t have all the answers about what users would value most. I had to create a flexible foundation that could evolve as we learned, rather than a rigid structure that would be difficult to change later.
Impact
Product validation:
- Supported successful alpha release with initial client pilots
- Positive feedback from enterprise clients across strategic and analyst personas
- Validated appeal across multiple user types with different expertise levels
Business outcomes:
- Positioned DataVoyant as a key SaaS offering within Amplyfi’s product suite
- Demonstrated product-market fit for future investment and development
- Created foundation for subsequent feature development and scaling
User outcomes:
- Delivered clarity and confidence in competitive intelligence outputs
- Reduced time to insight for strategic decision-making
- Enabled deeper research workflows for analyst users